
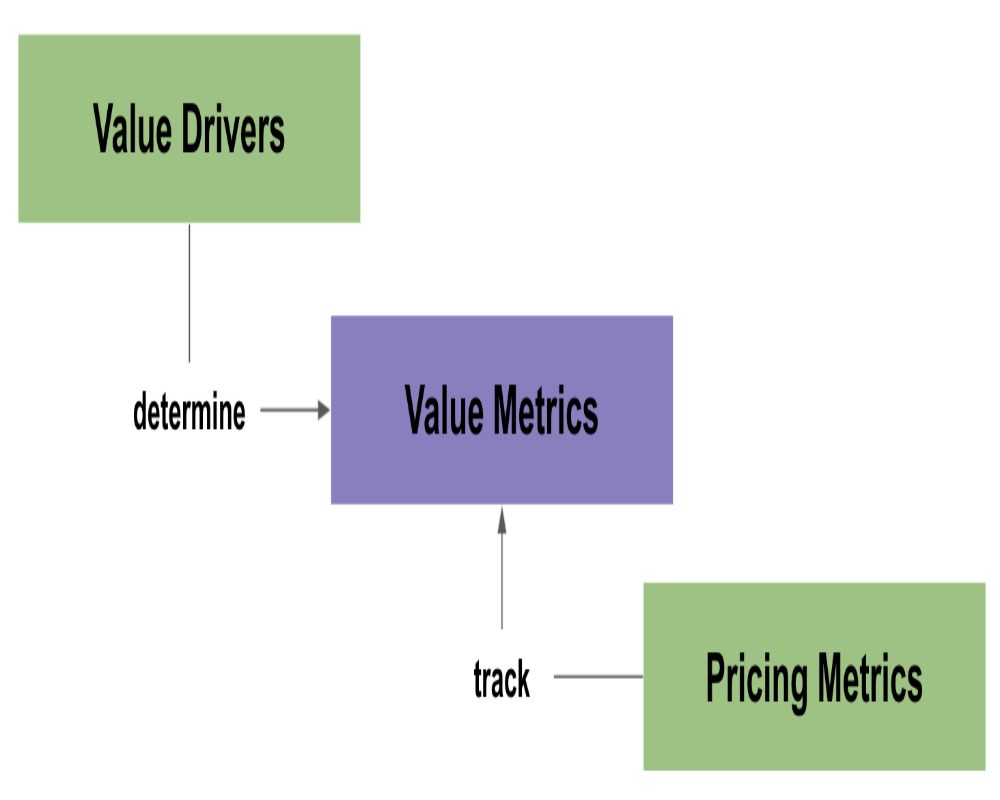
Recovering value from a distressed or underutilized industrial land asset requires clear pricing benchmarks and return expectations. Pricing metrics help evaluate whether the land can appreciate, generate income, or be liquidated at a profitable value within a defined investment window, typically 2 to 7 years. Below are five critical pricing metrics that support value recovery, especially when used as part of a structured exit strategy:
1. Price Per Square Foot (Land vs. Developed Asset)
- Compares current land price per sq ft. to recent sales of similar industrial plots in the area.
- If nearby developed plots command a significantly higher rate, there’s recovery potential via development or rezoning.
- Acts as a baseline to assess appreciation feasibility through site upgrades.
- Helps estimate the value gap between raw land and the post-improvement asset.
2. Capitalization Rate (Cap Rate)
- Measures the ratio of net operating income (NOI) to the purchase price.
- A low purchase price with potential for higher lease income leads to an improved cap rate.
- Target industrial cap rates typically range between 6% to 10%, depending on region and asset type.
- Helps assess value recovery through lease-and-hold strategies over the investment window.
3. Comparable Sales Analysis (Market Value Benchmarking)
- Tracks recent transaction values of similar plots in the same micro-market.
- Accounts for location, plot size, access to utilities, and zoning.
- Demonstrates potential upside by identifying undervaluation due to non-market reasons (distress, legal delay, etc.).
- Supports pricing decisions for exit via resale or subdivision.
4. Development Cost vs. End Value Ratio
- Evaluates the cost of site improvements (grading, utilities, fencing) against projected resale or rental value.
- A favorable ratio (e.g., 1:2 or higher) indicates room for profitable value addition.
- Allows financial modeling of break-even timelines and margin projections.
- Useful for decision-making between hold, develop, or flip strategies.
5. Time-on-Market and Absorption Rate
- Time-on-market data shows how long similar parcels take to sell or lease.
- Absorption rate indicates the market’s pace in consuming available industrial space.
- Lower absorption or longer time-on-market suggests a slower exit path.
- Tracking these metrics quarterly helps adjust strategy within the investment window.


