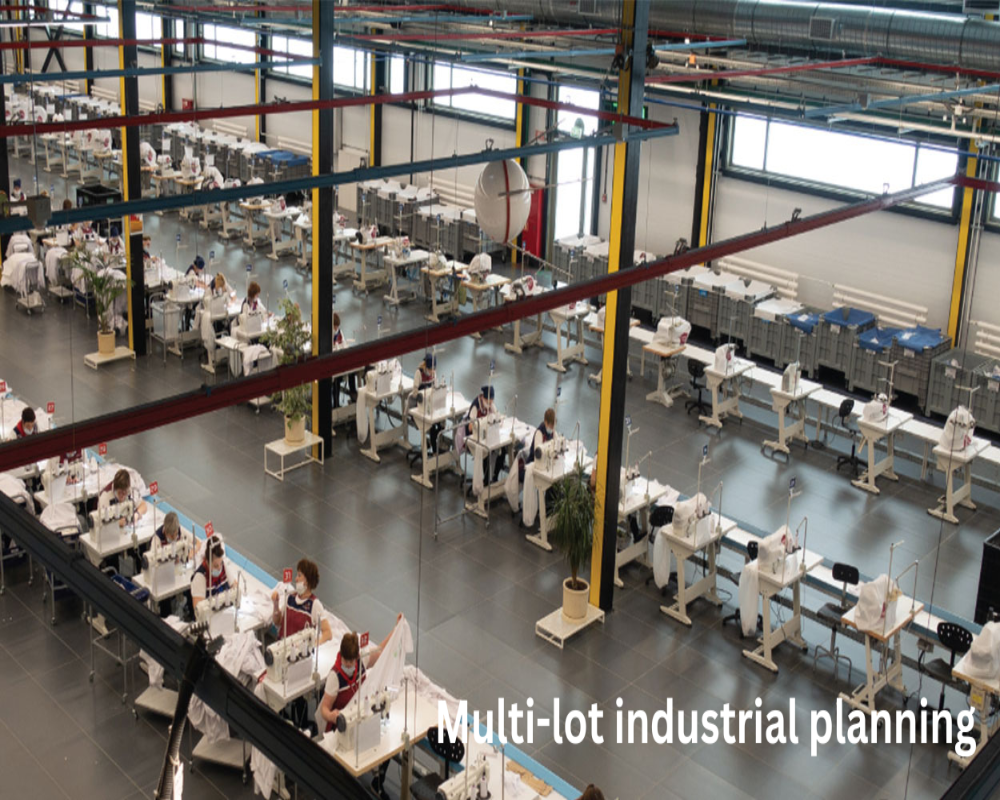
Absorption rate is a key metric in industrial land development that indicates how quickly parcels are sold or leased in a given region. When planning a multi-lot industrial layout—typically ranging from 5 to 50+ plots—developers and investors must evaluate absorption trends to ensure timely returns and minimize holding costs.
Below are the key absorption benchmarks and indicators that justify proceeding with multi-lot planning:
1. Annual Absorption Rate Above 20–30%
- If 20% or more of the total available industrial land in the region is absorbed annually, it suggests strong and sustained demand.
- Supports the release of land in phases, allowing for incremental development and pricing flexibility.
2. 3–5 Year Sell-Out Window for 70% of Inventory
- A region where developers or government parks have historically sold/leased 70% of lots within 3 to 5 years indicates:
- A stable industrial base
- Predictable demand from MSMEs, logistics operators, or light manufacturers
- A stable industrial base
- This justifies subdividing land into smaller, saleable units, rather than building-to-suit or long-term holding.
3. Absorption by Type of User Segments
- Strong uptake from multiple user categories (e.g., warehousing, assembly units, auto ancillaries) indicates diversified demand.
- This justifies creating plot variations (e.g., 0.5 to 2-acre lots) within the layout to cater to mixed-use buyers.
4. Comparison with Nearby Industrial Corridors or Parks
- If neighboring industrial zones within a 30–50 km radius show consistent absorption (e.g., 30–50 acres/year), the location is likely to replicate similar patterns.
- Also relevant is the waiting list or lack of inventory in nearby government-run parks, which can shift demand to private layouts.
5. Pre-commitments or Letters of Interest Before Launch
- If 30–40% of your lots are pre-booked or reserved before development begins, this reflects clear market confidence.
- In such cases, full-fledged multi-lot infrastructure investment (roads, drains, power) is viable.


